Restaurant Profit and Loss Statement
Determine restaurants profitability and analyse costs with ease using this spreadsheet by Alex BejanishviliThe restaurant profit and loss statement makes it easy for restaurant and cafe owners to keep track of their sales, costs and profits. With space to fill in weekly information over a five week period, it is ideal for recording profit and loss over a one month period. With spaces to compare your actual sales against your budget and last year, it is easy to see whether you are staying on track.
Each week has just three sections to complete: cover data, sales and costs. From this, your costs share distribution, average sale per cover and net profit will be calculated, and summarised in a shareholder scores section at the top of the page. On each sheet is space to enter your company name, address and logo, as well as the date covered, making the statement look your own.
Restaurant Profit and Loss Statement
for Excel® 2003+File: XLS
File: XLSX
1.0.2
Microsoft Excel® 2003 or Higher (PC & Mac)
Not Used
Not Required
Alex Bejanishvili of Spreadsheet123.com
User License Agreement
Contact Us
Restaurant Profit and Loss Statement Pro
Professional 1.0.2
.ZIP
Microsoft Excel® 2003 or Higher (PC & Mac)
Not Used
Not Required
via Email 24x7
Visit Support Page
- Unlocked - so that you can customize it just a little more.
- Contains Fields for Logo & Company info
- Ability to insert more rows
- Technical Support (for 90 days)
Cover Data
Use this section to enter the number of customers for breakfast, lunch and dinner. Simply enter your cover numbers into the actual column for breakfast, lunch and dinner. To compare against plan and last year, ensure you fill these columns in too, and the comparison against both your budget and last year will be automatically completed for you. Green text and arrows indicate in increase compared to your budget or last year, while red text and arrows indicate you are down against budget or the previous years. If your actual cover numbers match your budget or last year cover numbers, you will see a blue arrow.
Sales Data
As with the cover data section, there is space here to fill out your actual, budget and last year data. There are rows, for filling in your food sales for breakfast, lunch and dinner separately, as well as a line for beverages, and one for any other sales you may make. Once all sections are complete, the comparison against budget and last year will be automatically generated for you, with the same colour scheme as in cover data visible.
Costs
The costs section provides spaces to fill in a wide variety of costs that can be expected in a restaurant. The costs list is grouped into sections, starting with labour costs, such as managers salary, kitchen labour cost, bar labour cost, breakfast labour cost, dinner labour cost and other labour costs. Food is split into food inventory opening, food cost and food inventory closing. Similarly, beverages are split into beverage inventory opening, beverage cost and beverage inventory closing. Aside from food and drink costs, there is space to enter any other expenditure, including cleaning materials, glassware and cutlery, kitchen replacement, guest supplies, printing and stationary, miscellaneous, music and entertainment, and equipment hire. If any of these do not apply, simply enter 0, and a dash will be displayed in the cell, indicating there is no information to display for this category.
As with the cover and sales data, completing the budget and last year columns will allow the spreadsheet to calculate a comparison against each, and these will be colour coded with arrows to indicate whether or they are an increase or decrease.
Costs share distribution
The cost share distribution calculates a total cost from each of the four categories: food, beverages, labour and other, giving a gross profit margin from each category based on this. There is nothing to enter in this section, as figures are calculated automatically based on the data entered in the cover data, sales data and costs section.
Average sale per cover
The average sale per cover section calculates the average spend per customer in each of the beverage, dinner (lunch and dinner) and breakfast categories. Again, this information is automatically calculated based on information entered elsewhere on the spreadsheet.
Net profit
The net profit section automatically creates three calculations for you. The first, net profit, simply shows sales minus costs. The net profit percentage shows your profit as a proportion of all sales, while the net profit per cover calculates the net profit per customer.
Shareholder scores
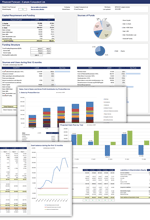
The shareholder scores section at the top of each worksheet shows a summary of the vital details found elsewhere on the sheet. Sales, costs, net profit, net profit percentage, food gross profit margin and beverage gross profit margin are all found here, allowing you to compare weekly figures at a glance.
P&L period summary
The P&L period summary is a separate sheet that can be found at after the weekly worksheets. It adds together cover, sales and costs data found on the five weekly worksheets, calculating shareholder scores, cost share distribution, average sale per cover and net profit across the entire five week period.


